Make every tech decision a business decision
Correlate full stack performance with key business metrics like conversions and quickly resolve issues before they impact the bottom line.
Learn moreAs the world’s only business-first observability platform, AppDynamics accelerates your digital transformation with the insights you need most.


Explore
full-stack correlation:
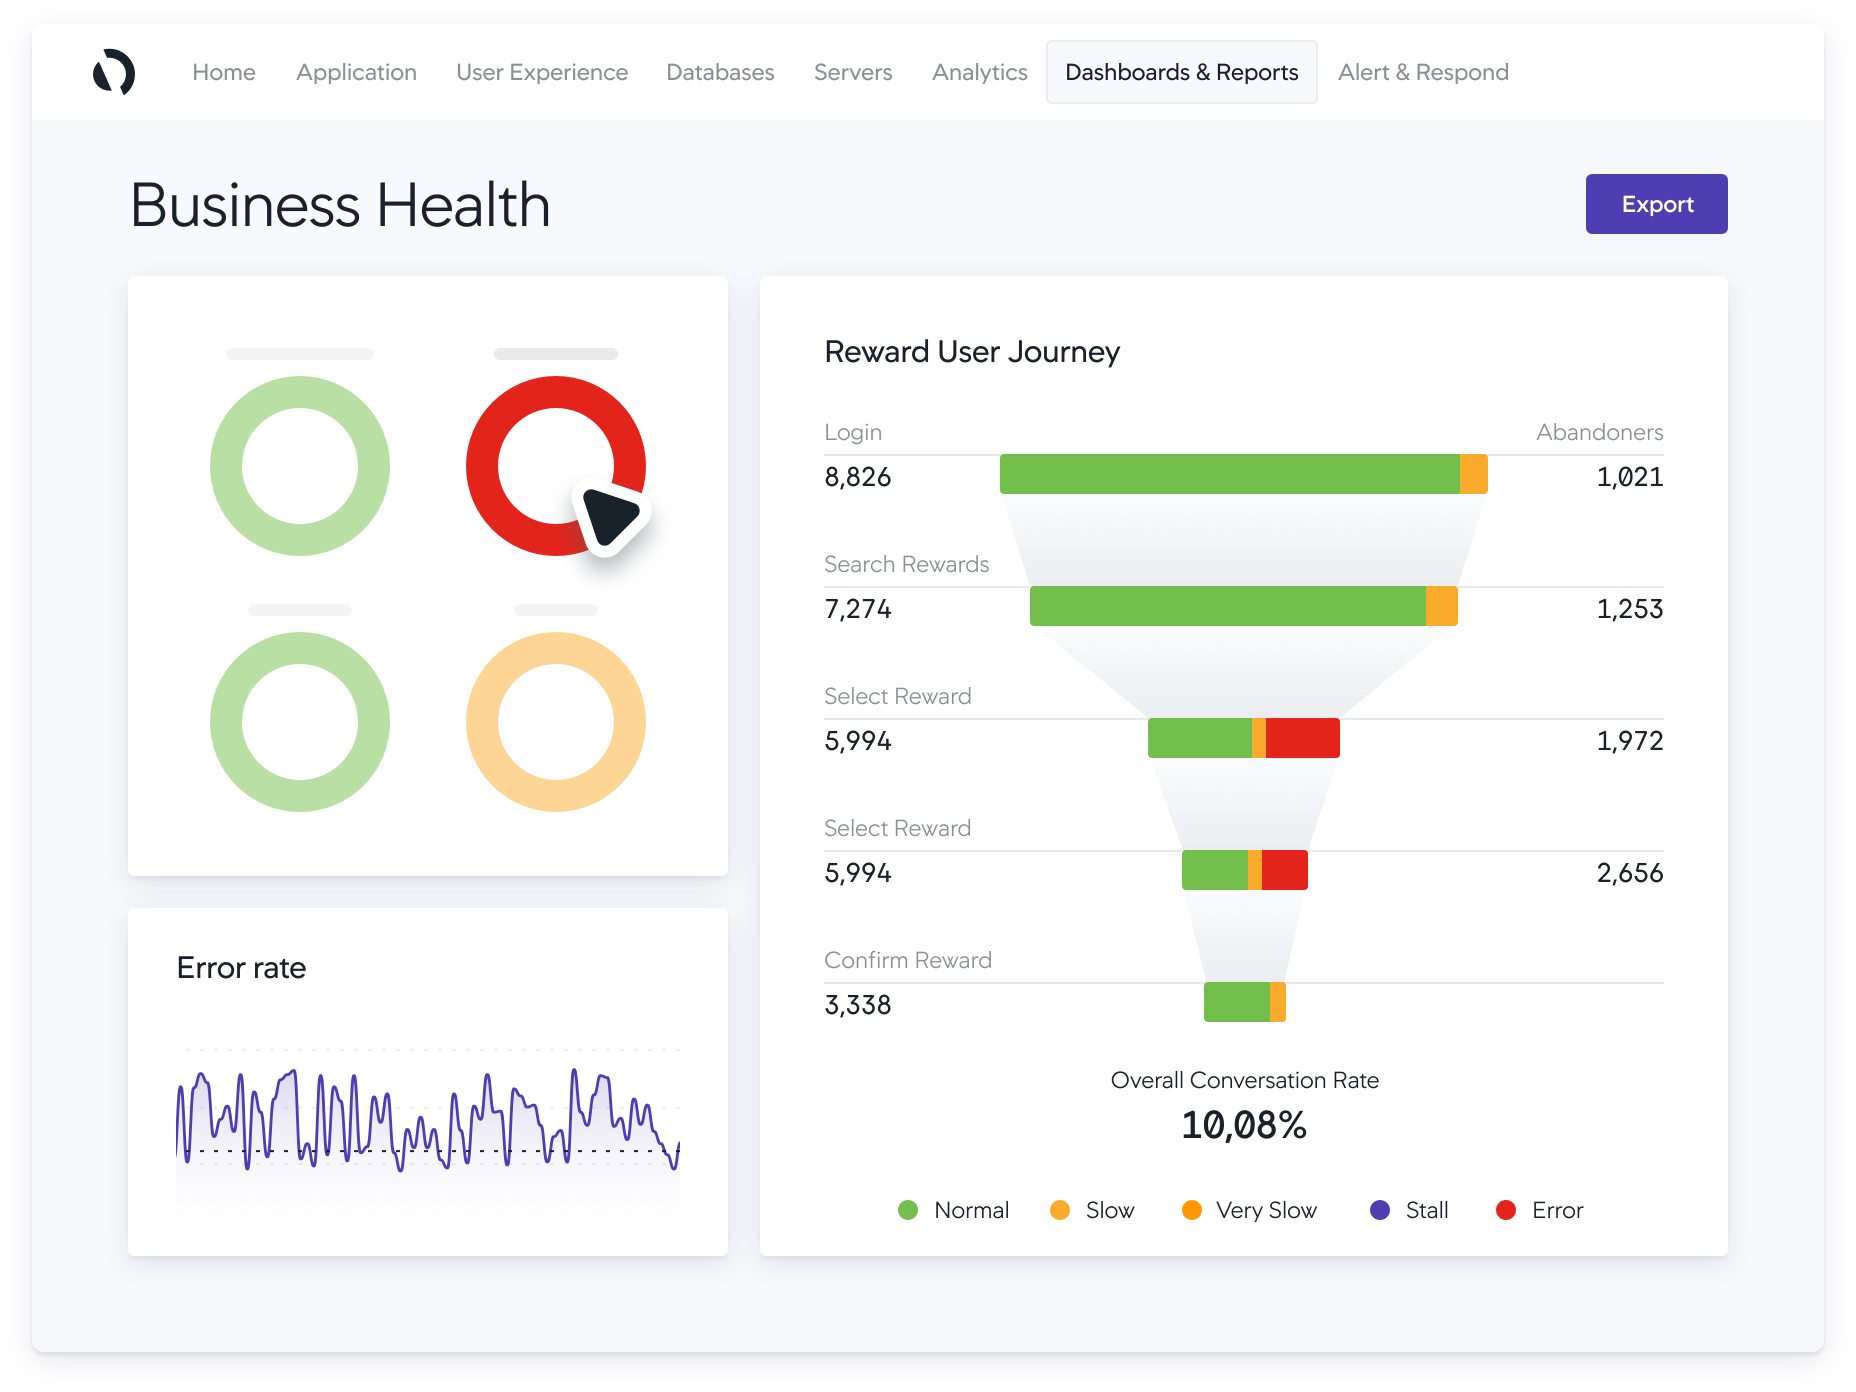
Correlate full stack performance with key business metrics like conversions and quickly resolve issues before they impact the bottom line.
Learn more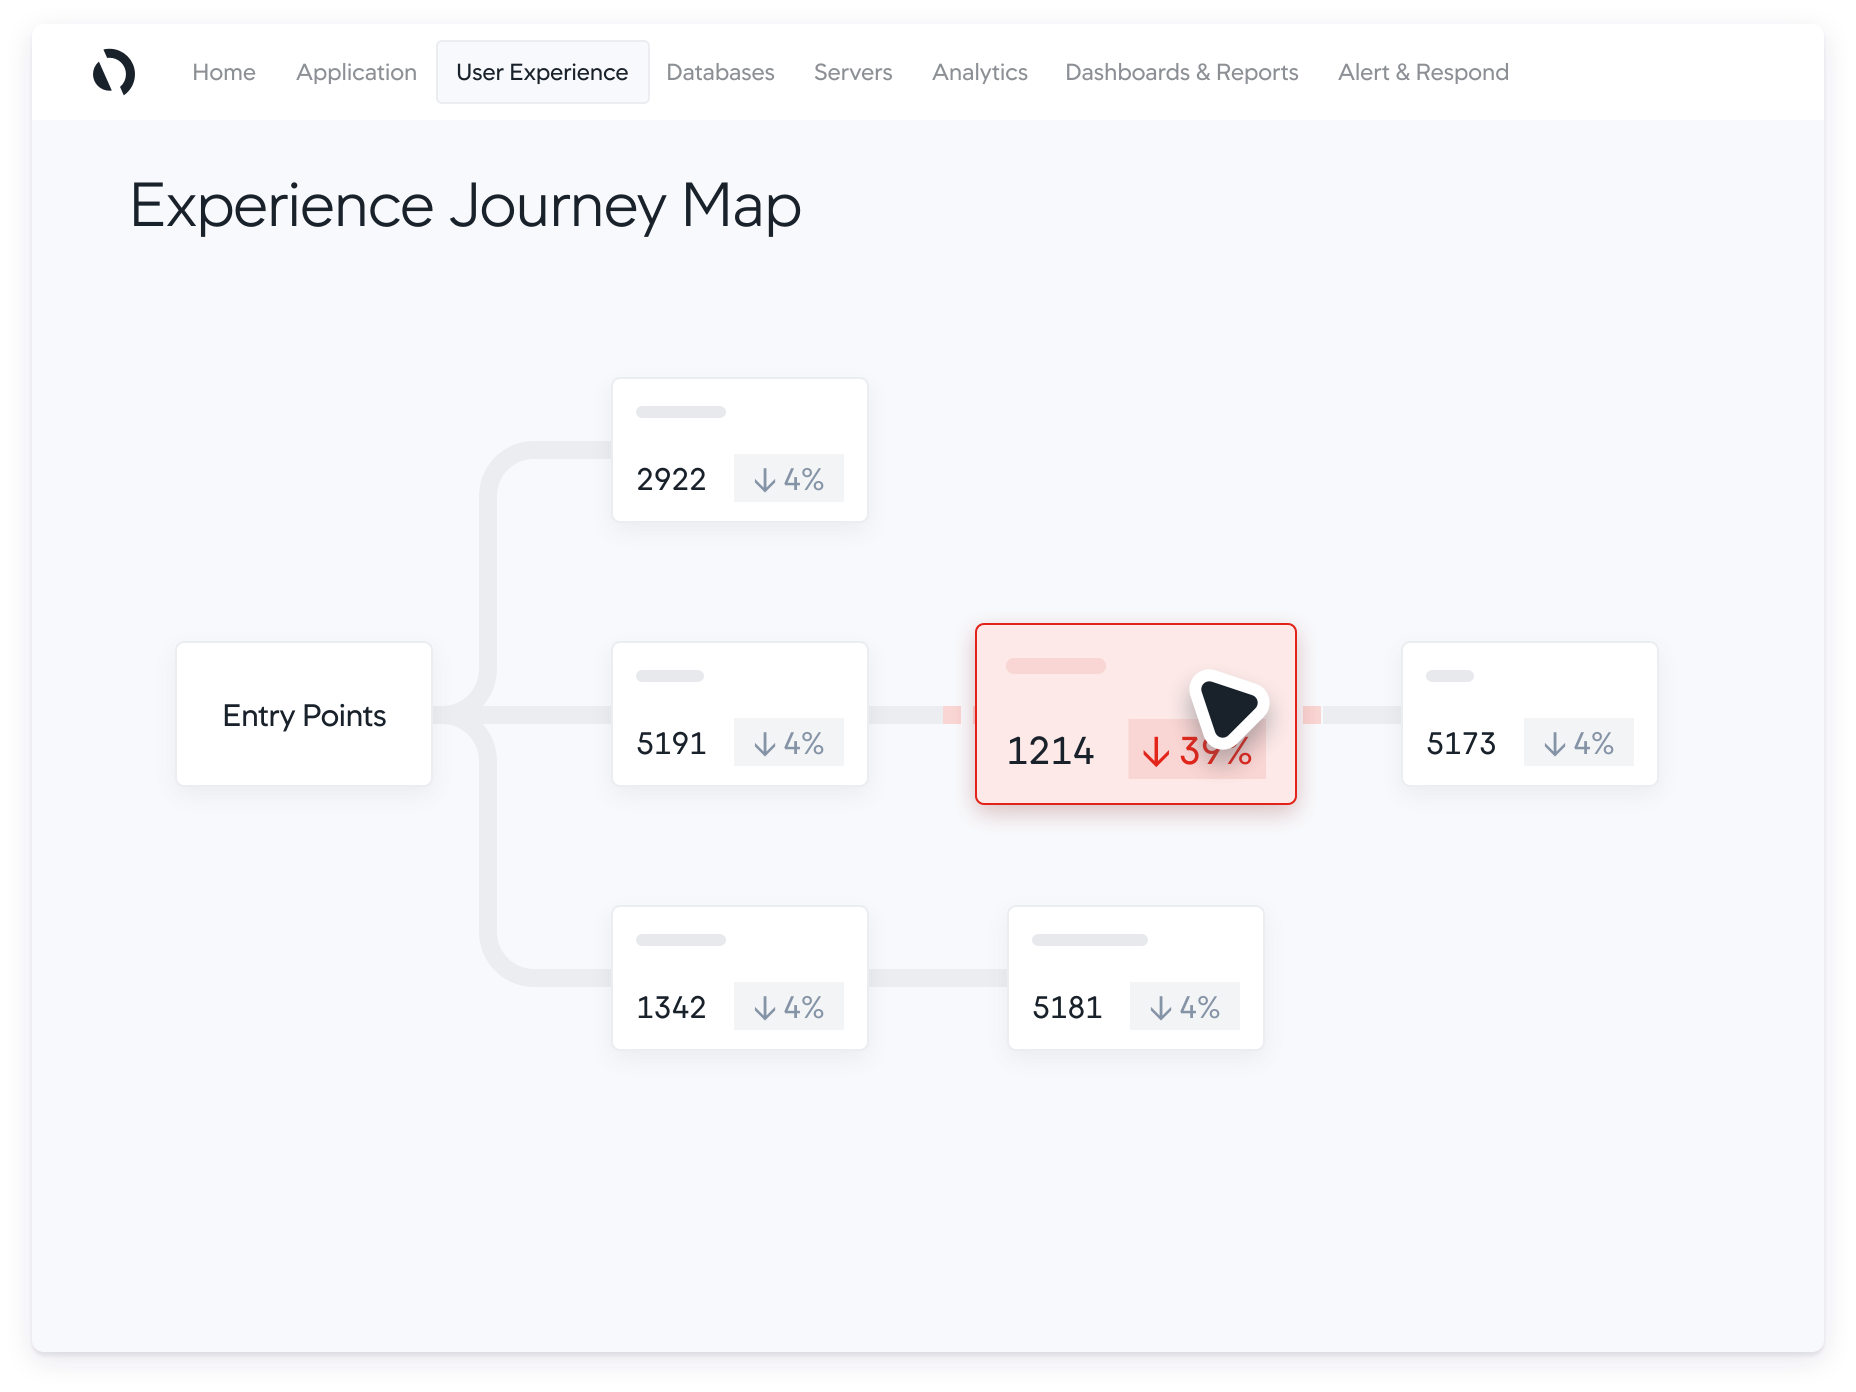
Visualize the digital experience between your users and your business and ensure a seamless, hassle-free experience at every touch point.
Learn more
Pinpoint root causes of application problems in real time, from 3rd party APIs down to code level issues, so your IT teams can quickly identify what’s most affecting your key business metrics.
Learn more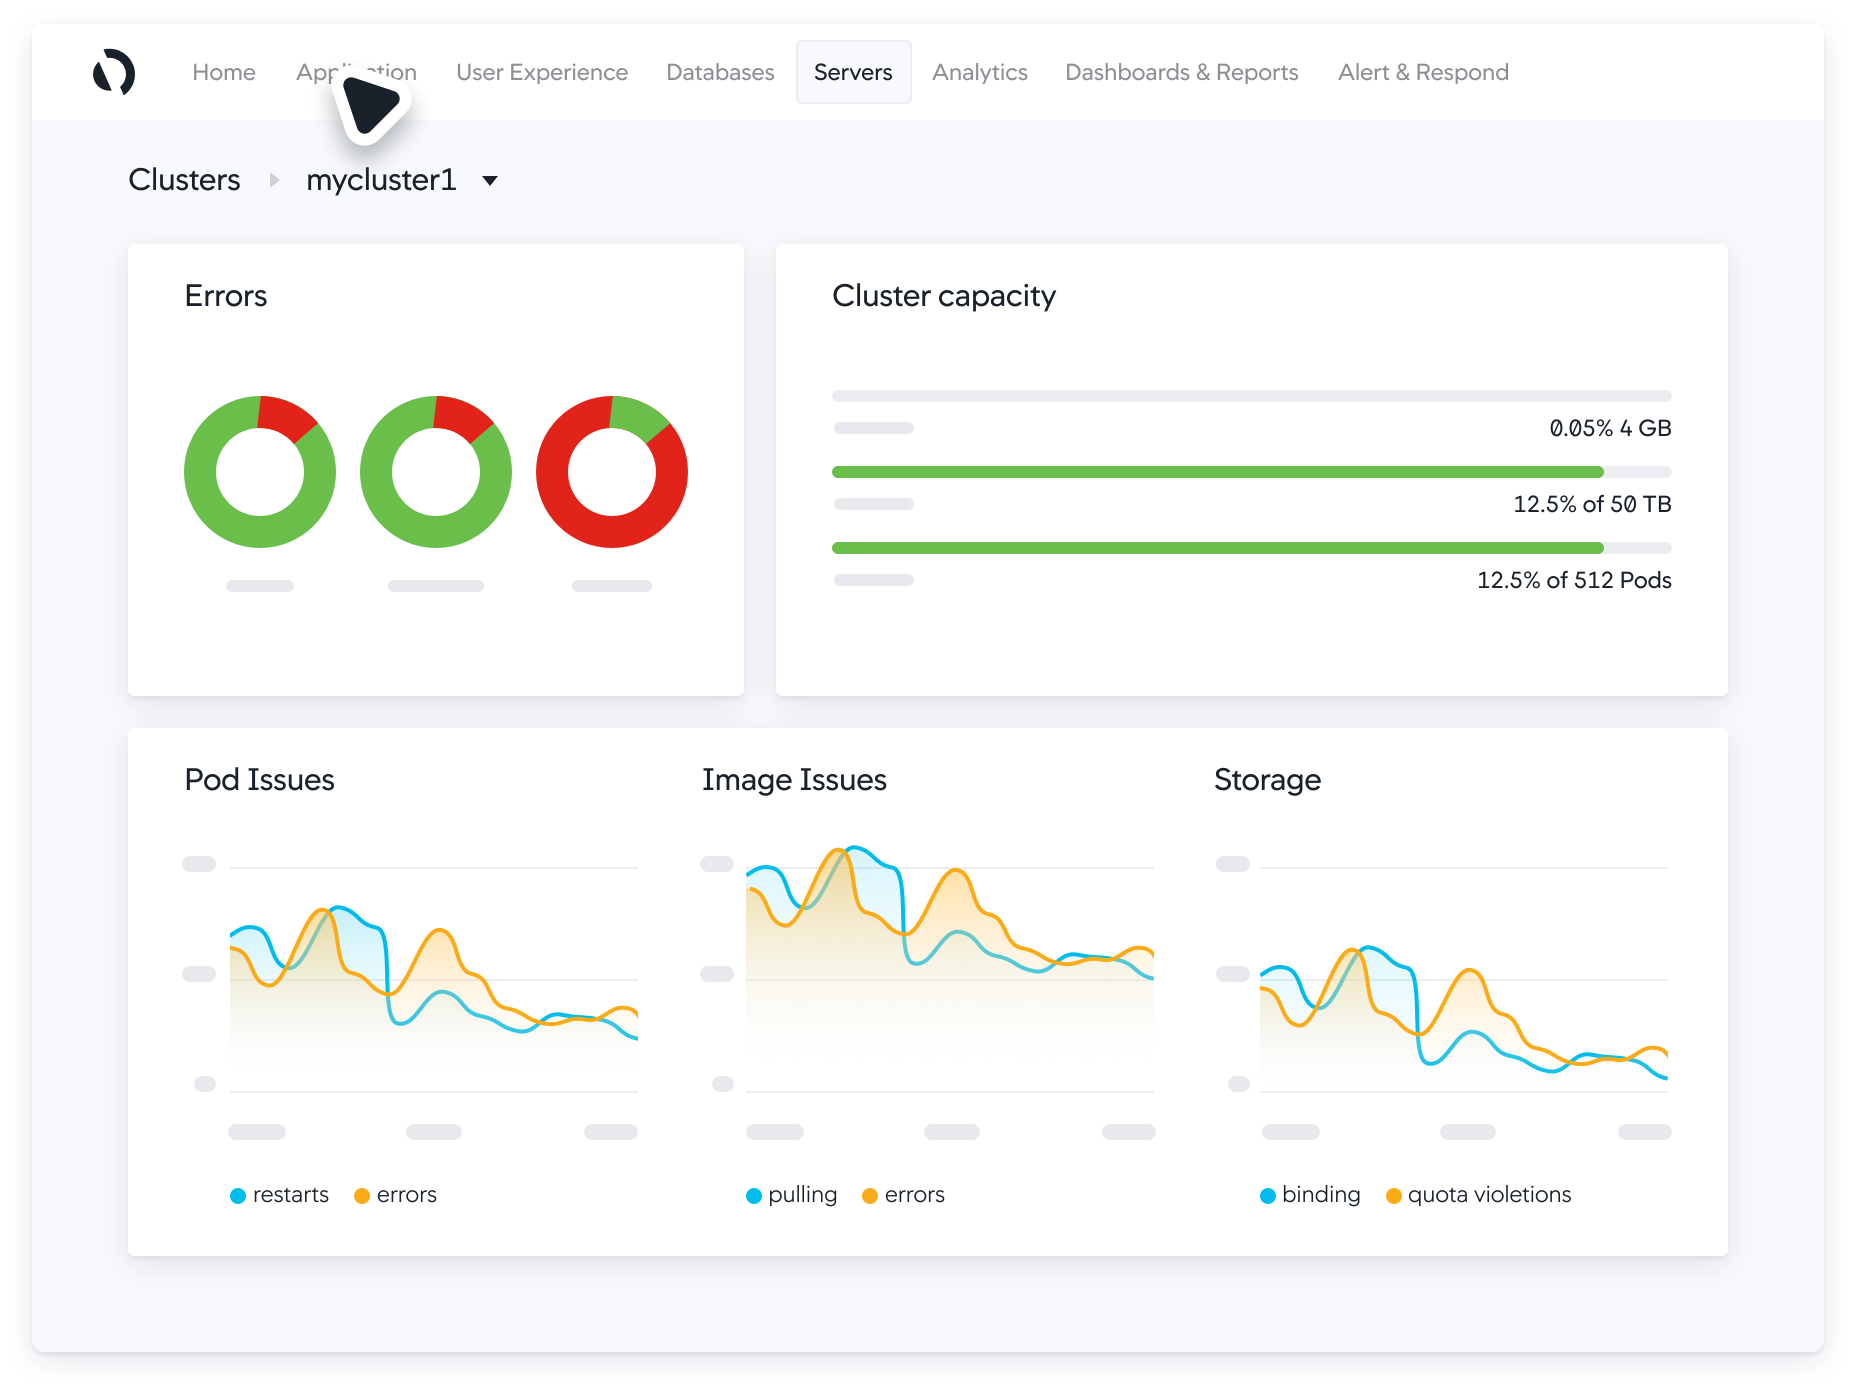
Visualize every component of your infrastructure — from server, to database, to hybrid and cloud native environments — supporting optimal application performance.
Learn more
See the external networks your apps rely on to gather insights and quickly resolve issues with any ISP, SaaS, DNS or third-party provider.
Learn more
Detect application code and security vulnerabilities in minutes — not months — with unified business, performance and security insights.
Learn more
Powered by the Cisco FSO Platform, Cisco Cloud Observability provides observability across your technology landscapes from the application layer down to your Kubernetes® and cloud infrastructure allowing you to correlate the entities across cloud native landscape, troubleshoot issues and identify root causes.

"It’s a tool that offers seamless traceability and a view that bridge both the APM and the Business product usage effectively. "
Heather Abbott,
Senior Vice President of Corporate Solutions Technology

Get complete visibility into all of the components that make up your application ecosystem and see how they depend on one another.

Focus on what drives business results. Instant root-case analysis helps your teams pinpoint the source of problems across the entire stack, in real time, helping you be proactive and not reactive.

Continually optimize your application environment with a vast ecosystem of interconnected technology partnerships.

Thank you! Your submission has been received!
Oops! Something went wrong while submitting the form