As an application owner, monitoring performance of your application is already second nature. However, are you reactively monitoring your application? In other words, do you review performance metrics after an application issue or outage occurs in hopes to identify problem areas? Or are you also proactively monitoring your application? In this case, you actively receive alerts or notifications about performance degradation before an actual issue or outage happens. In this article, we will discuss how to use AppDynamics to proactively monitor your application.
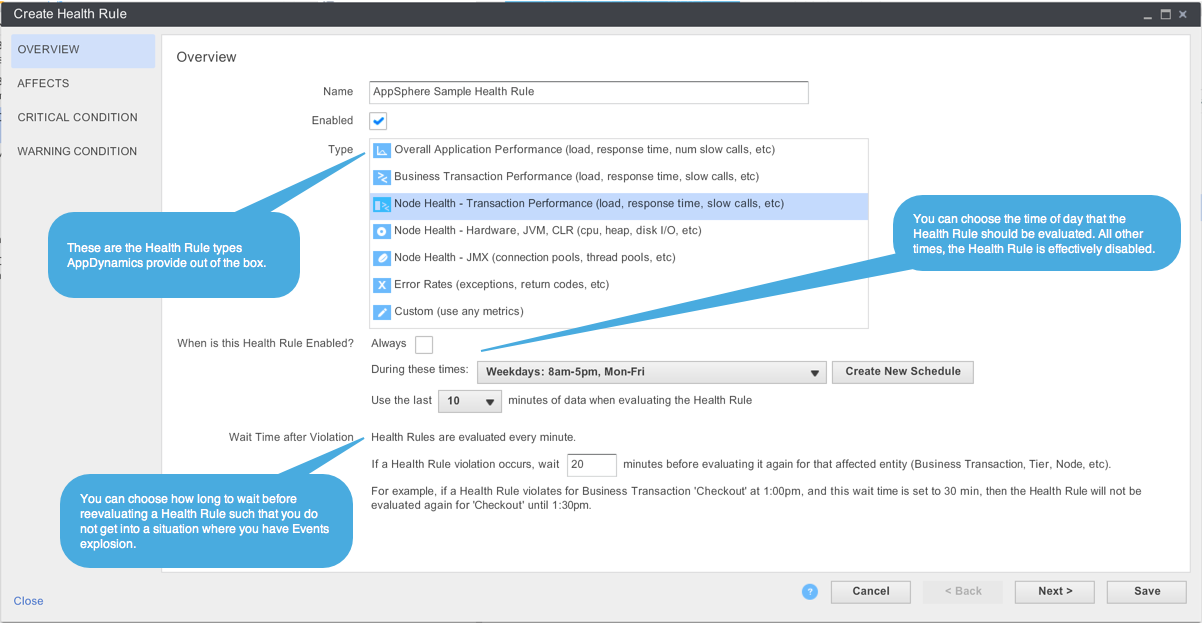
In AppDynamics, you can define a set of Health Rules where each contains a set of conditions that maps to key performance indicators measuring the health status of your application.
By default, AppDynamics already has a few Health Rules enabled. For example, the “CPU utilization is too high” Health Rule will trigger a “Health Rule Violation Started – Warning” event if CPU utilization on a node is above 75% and a “Health Rule Violation Started – Critical” event if it is above 90%.
You can define your own Health Rules based on the template types that AppDynamics have defined. Each template type provides a set of entities, such as Business Transaction, Node, Tier, or JMX Object, and “health rule” metrics tied to those entities.
Once you have decided a Health Rule type, you have to pick the entity that the Health Rule applies for. This is required because a Health Rule needs an object to evaluate against.
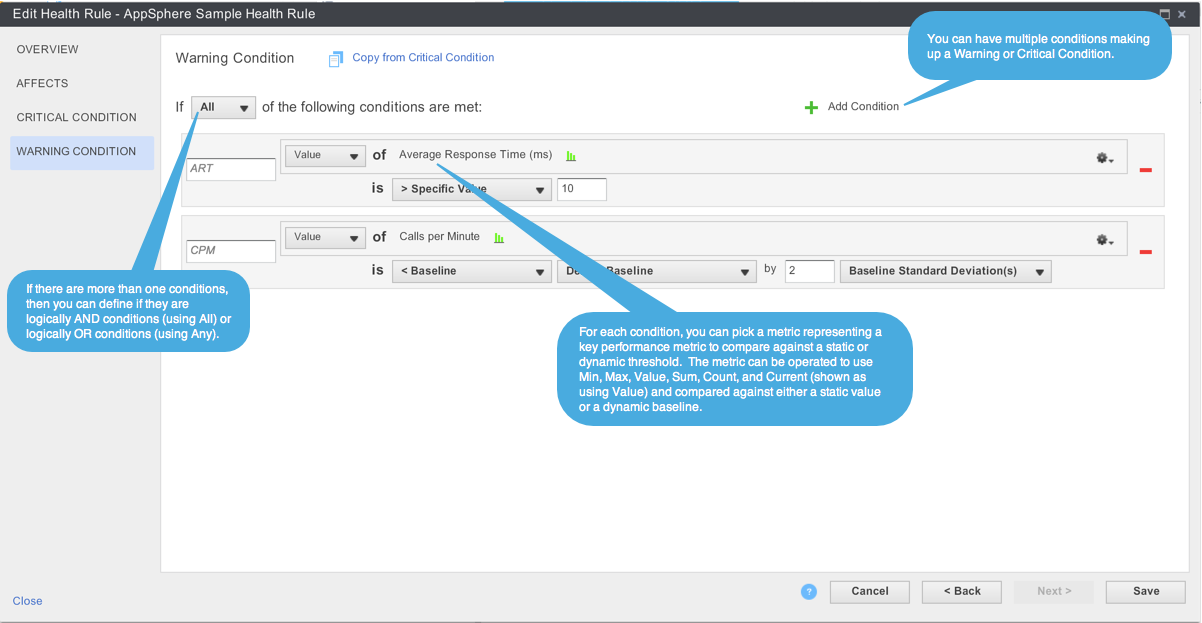
After choosing the entities to evaluate against, you will have to build the conditions that reflect either a warning or critical status of your application. For each status; warning or critical, you can define one or more conditions where each compares a key performance metric against a static value or dynamic baseline. For example, you can build a warning condition that triggers when a node’s Average Response Time is greater than 10 ms and Calls Per Minute is less than 2 standard devision of the default baseline. Careful consideration should be taken when defining these condition sets such that it triggers as a forewarning of imminent issues.
For detailed information on Health Rules, please refer to this AppDynamics document
Now that you have a Health Rule defined, you will get an event triggered off of your defined condition. However, you still need to look for the event after an issue or outage to know of its occurrence. To have AppDynamics proactively alert you of an event occurrence, you still need to define a Policy and associated Actions corresponding to your Health Rule event.
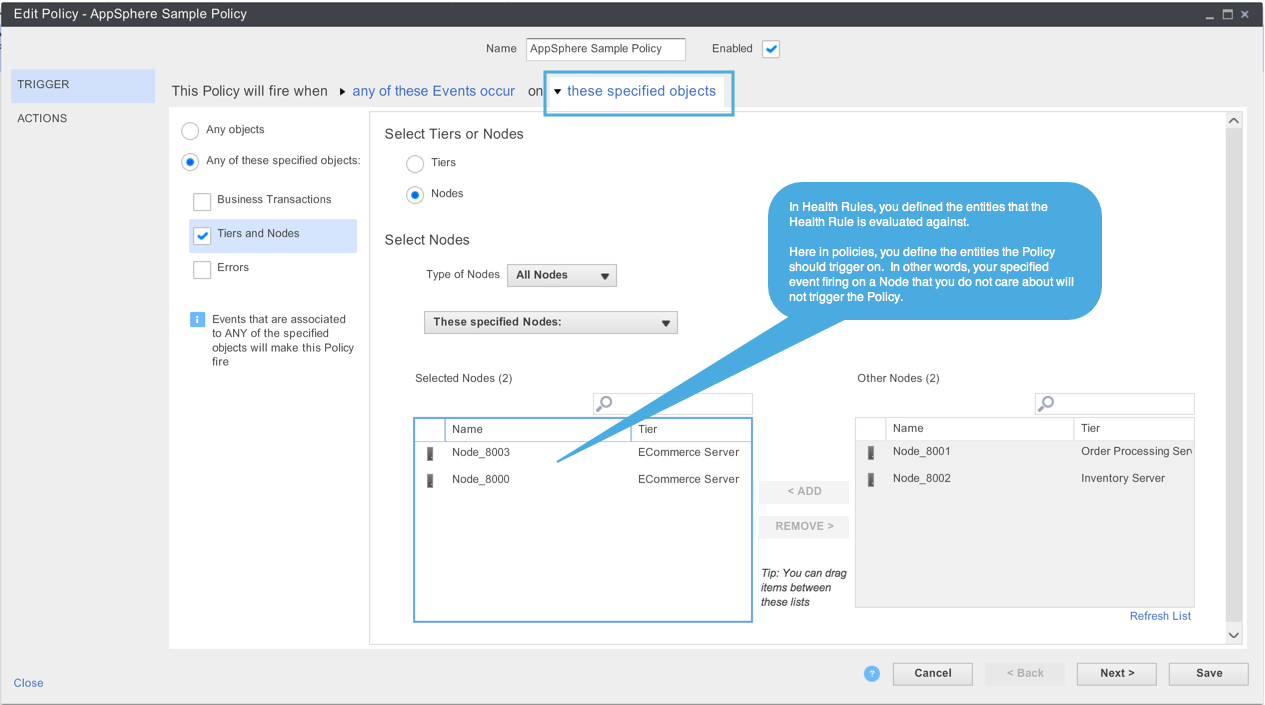
In AppDynamics, a Policy monitors the events logged and when an event that matches the policy’s triggering condition appears, then the policy fires a set of Actions associated to it. The Policy triggering condition consists of matching events and matching entities such that an event must be a specific type, for example Health Rule Violation Started – Warning, and occurs on a specific entity, for example Node 2.
For detailed information on Policies, please refer to this AppDynamics document
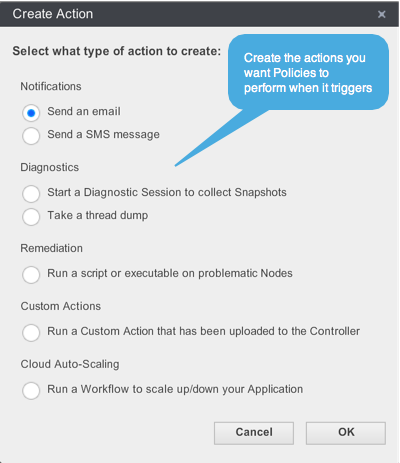
Once you define the triggering conditions for the Policy based on the Health Rules you created, it is time to define what set of Actions you want AppDynamics to perform when the policy fires. There are many types of actions available to you in AppDynamics. From simple alerting actions via email or SMS, to diagnostics actions such as starting Diagnostic Sessions or taking thread dumps, to advanced custom actions to integrate with existing alerting systems such as JIRA or PagerDuty. AppDynamics has it all.
Check out AppDynamics Exchange to find Alerting Extensions that can make your policies even more powerful. Alerting extensions include custom actions that sends alerts to PagerDuty, ServiceNow, and more. For more information, check on AppDynamics Exchange here. For detailed information on Actions, please read this AppDynamics document
Voila! With Health Rules, Policies and Actions in place, AppDynamics is ready to proactively alert you when your application begins to experience performance degradation. The key to successful proactive alerting is to define that set of Health Rules and triggering Policies that will fire off when your application is entering a state of concern. This will undoubtedly require intimate knowledge of the application as well as the application’s operations. Here is a good example: degraded average response time when call volumes are high might be normal for your application, hence, define the health rule to include the condition of calls per minute lower than average operations (using a baseline).
Now go enjoy the praise while you resolve issues before they impact business operations or result in outages!
Take five minutes to get complete visibility into the performance of your production applications with AppDynamics today.


