New Relic and AppDynamics up the ante on Prometheus with dashboards that display Kubernetes time-series data, and monitoring alerts that sync with IT automation tools.
Time-series databases such as Prometheus turned heads among early adopters of containers, but application performance management users now have Kubernetes monitoring options built into familiar tools.
Some IT shops eager for detailed Kubernetes metrics have integrated time-series databases with homegrown or open source dashboards. But APM tools now aggregate, correlate and visualize those layers of data in one place to trigger alerts.
Enterprises have kicked the tires on the latest Kubernetes monitoring tools from New Relic and Cisco AppDynamics and found they offer the same granular data as time-series approaches with easier-to-manage user interfaces. New Relic's Infrastructure tool, released in public beta on April 28, creates dashboard views of time-series data from the Kubelet API and Kube State metrics* and correlates that data with application services. Cisco's AppDynamics Kubernetes monitoring, which will be generally available on May 9, triggers autoscaling functions in response to resource constraints with Cisco's CloudCenter infrastructure automation software.
Prometheus data collection no longer alien to New Relic users
Slalom Consulting, a global business and technology advisory firm based in Seattle,* uses New Relic Infrastructure to help a fitness equipment supplier troubleshoot a Kubernetes-based mobile application on AWS.
"We run multiple instances of the same services in Kubernetes clusters, and with traditional APM we don't know which service is having a problem, where it's running, or where the problem is happening," said Tim Whitney, practice lead architect at Slalom.
Before New Relic's ability to collect data from Kubernetes data, Whitney's team struggled with issues in which engineers want to respond quickly to capacity requirements as they change, such as a provisioning problem with AWS DynamoDB databases. Now New Relic can indicate not only that DynamoDB is over capacity, but which Kubernetes Pod and application service needs it, so engineers know where to scale.
New Relic Kubernetes monitoring also gives beta testers at Discovery Communications, based in Silver Spring, Md., a visual overview of container clusters. The media and entertainment firm could manually access the same data before with a combination of open source monitoring through Heapster and data from Prometheus and StatsD, but only via a command-line interface, while New Relic dashboards update automatically.
New Relic dashboards show the number of Kubernetes Pods that run on each of Discovery's container clusters and whether any have crashed, and charts low-level metrics such as CPU utilization. This helps Discovery to provision the right amount of CPU capacity for efficient Kubernetes services.
"We like that New Relic is SaaS-based," said Stephen Garlick, lead DevOps engineer at Discovery. "Otherwise it can be costly to set up our own metrics data collection server, and not having to manage our own metrics server also lets us run Kubernetes with a lean team of two to three people."
Garlick said he would like New Relic to expand its time-series data collection to environments beyond Kubernetes, and to release a container-based version of the New Relic synthetic private server so that performance tests that use synthetic monitoring can run in Kubernetes as well.
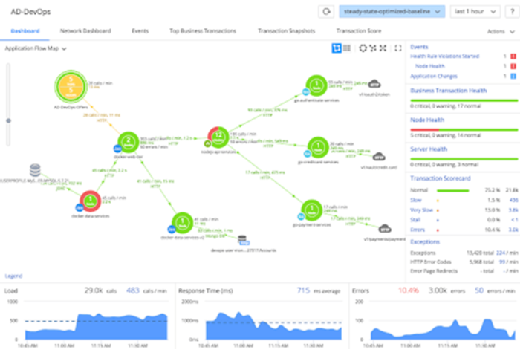
A screenshot shows an AppDynamics Kubernetes monitoring dashboard.
Cisco AppDynamics Kubernetes monitoring will also sweeten the deal for enterprise users when it becomes generally available this week. Enterprise users can automatically scale infrastructure up or down based on AppDynamics Kubernetes monitoring alerts, which has caught the attention of some Cisco shops.
The promise of [autoscaling] tools is to bring infrastructure sized for a 'high-water mark' of compute capacity needs down to manageable levels.
Sebastien Morissettesenior architect of infrastructure and security, Intact Insurance
"The promise of [autoscaling] tools is to bring infrastructure sized for a 'high-water mark' of compute capacity needs down to manageable levels," said Sebastien Morissette, senior architect of infrastructure and security at Intact Insurance, based in Toronto. "AppDynamics triggers for auto scaling in CloudCenter could give us a lot more intelligence than we have in our current scaling policies."
AppDynamics will pinpoint exactly which application requirements affect infrastructure resource demands, to guide application code revisions and avoid chewing up resources unnecessarily.
"Rather than just telling us a server needs more disk space, AppDynamics can show us that garbage collection in a Java app should be fixed, for example," Morissette said.
Intact already uses CloudCenter with Kubernetes integration, and will test AppDynamics in a new software-defined data center that will be joined as a hybrid environment to public clouds.
Each APM vendor's Kubernetes monitoring approach has pros and cons. Unlike New Relic, AppDynamics doesn't automatically collect metrics from Prometheus, but it can link to Prometheus with custom extensions, and displays much of the same metric data via Kubernetes and Docker APIs. AppDynamics's primary purpose is to monitor the applications that are deployed using Kubernetes, rather than metrics about the Kubernetes infrastructure. New Relic Kubernetes monitoring can link to autoscaling software through custom integrations, but doesn't offer autoscaling triggers out of the box.
Other APM competitors are also hot on New Relic's and Cisco's heels. Google's Stackdriver Kubernetes Monitoring, released in beta May 2, collects Prometheus data and monitors applications, containers, pods, clusters and servers in public and private clouds. Datadog also updated its Kubernetes monitoring support May 3 with a container map visualization tool.
* Information updated after publication
Dig Deeper on IT systems management and monitoring