Custom data visualization and dashboards
Build powerful dashboards with metrics from across your full stack to deeply understand how your technology is impacting your business.
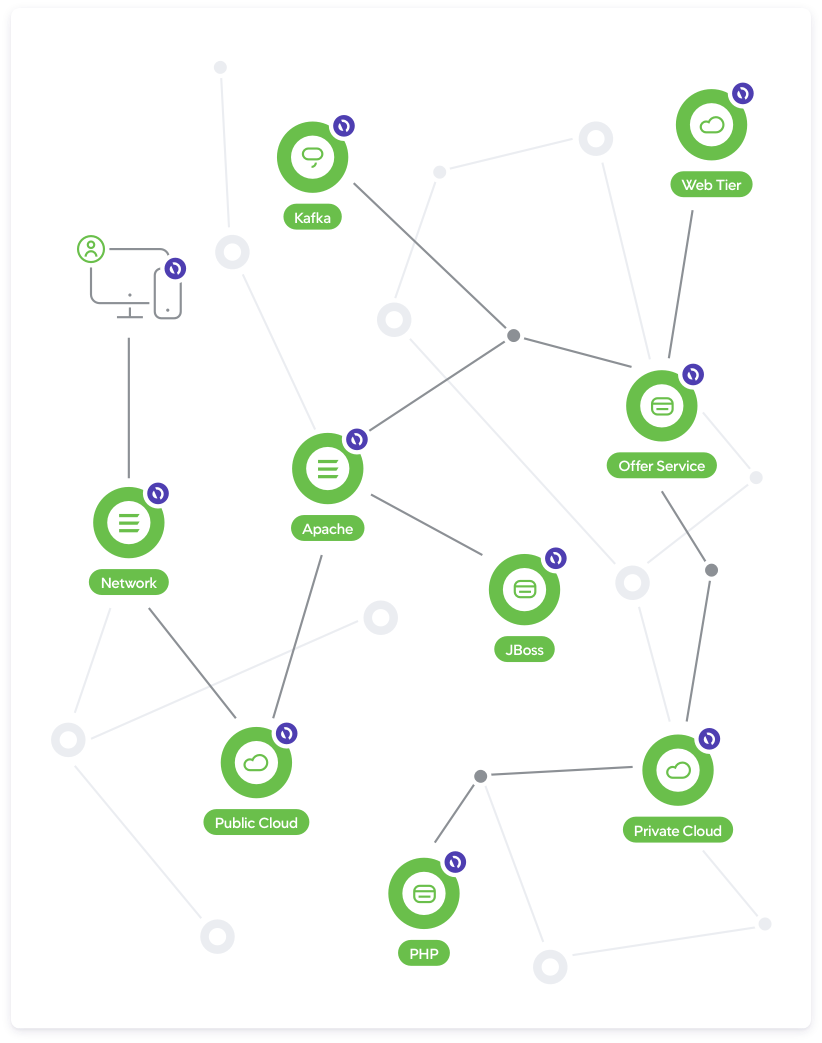
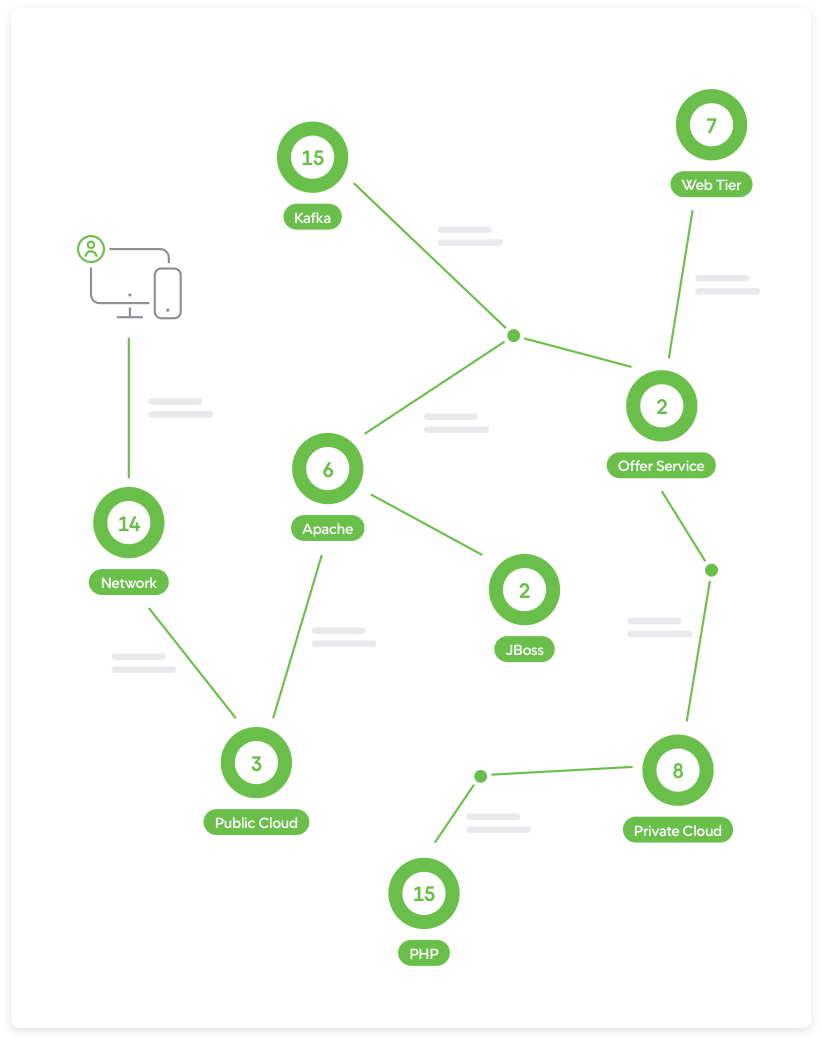
Full-stack observability + powerful data visualization
Our industry-leading data visualization tools analyze sophisticated data interactions within a simple user interface that everyone can understand, unlocking strategic insights across databases, applications and networks to bring immediate value to your business in just a few clicks.

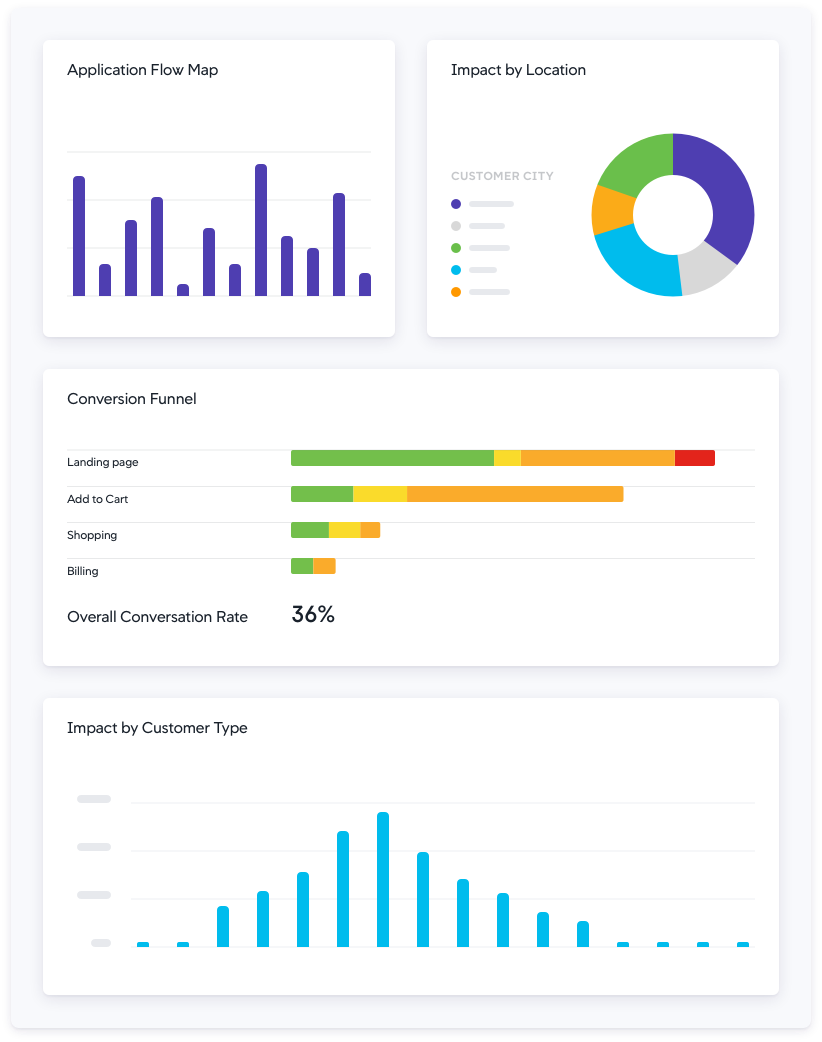
Visualize full-stack data in one place
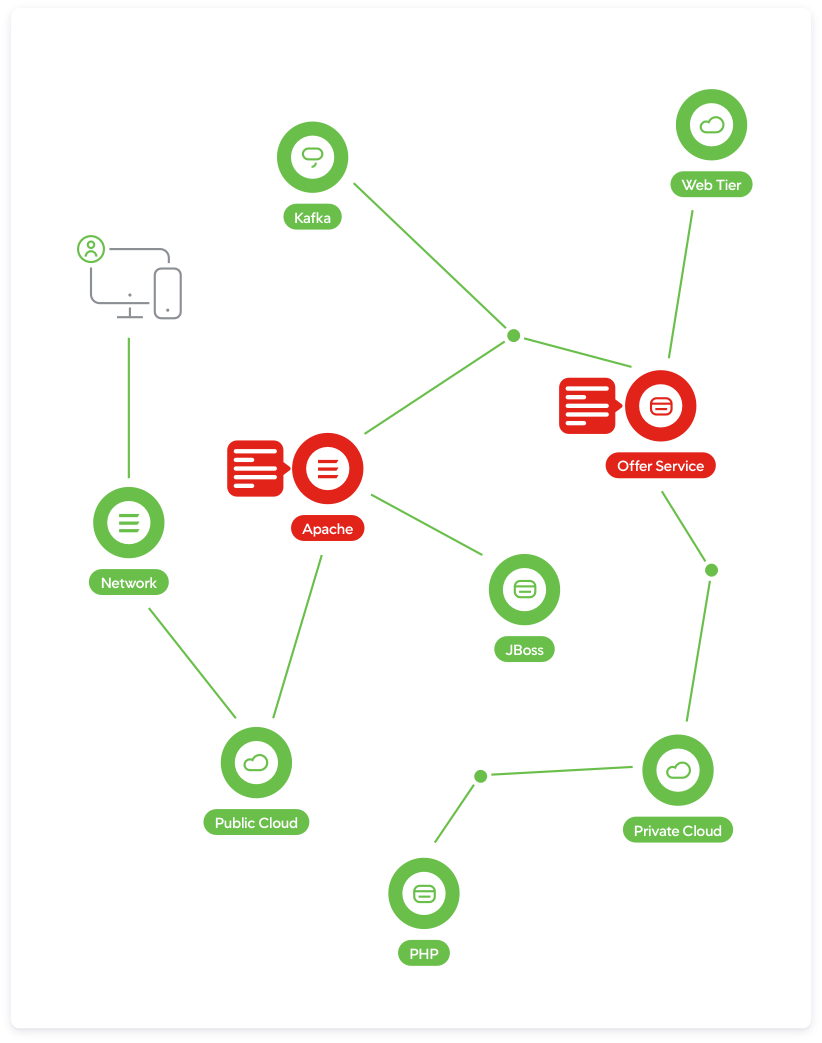
Dash Studio enhances our full-stack, business-focused observability by offering a unified visualization platform for data across every environment your business depends on
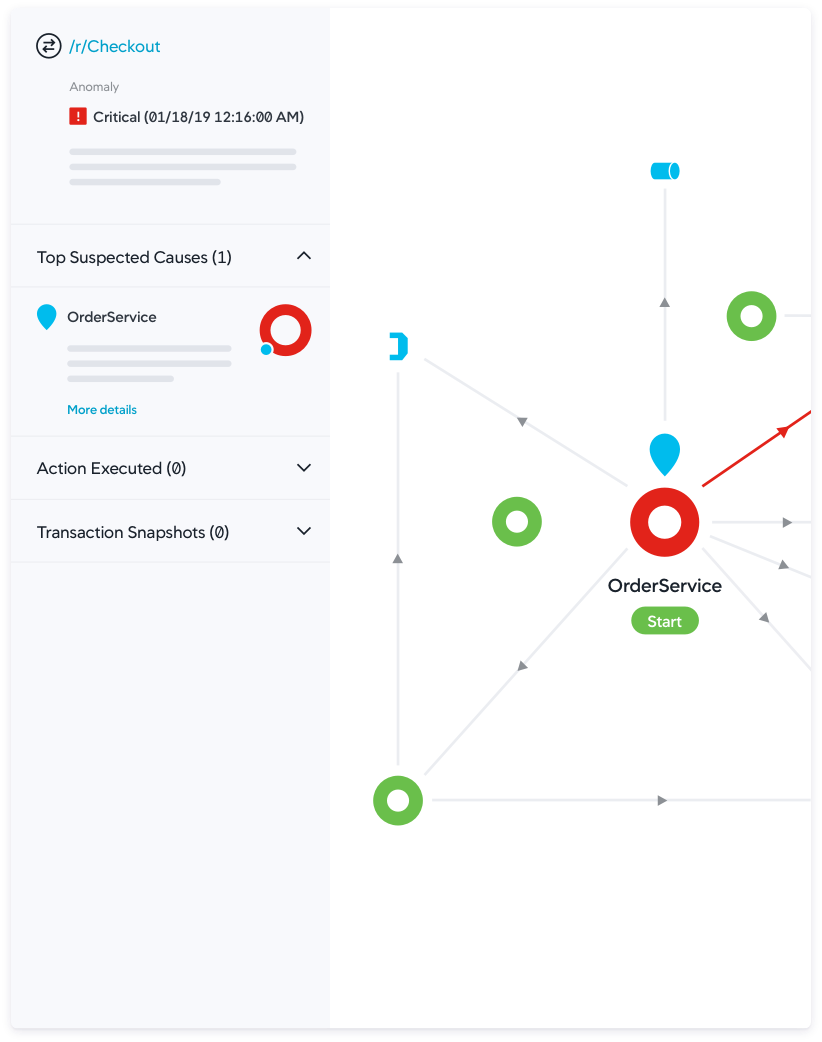
With ThousandEyes Internet and Cloud Intelligence in AppDynamics Dash Studio, easily isolate application issues from underlying network disruptions with a proactive view of the entire application delivery chain

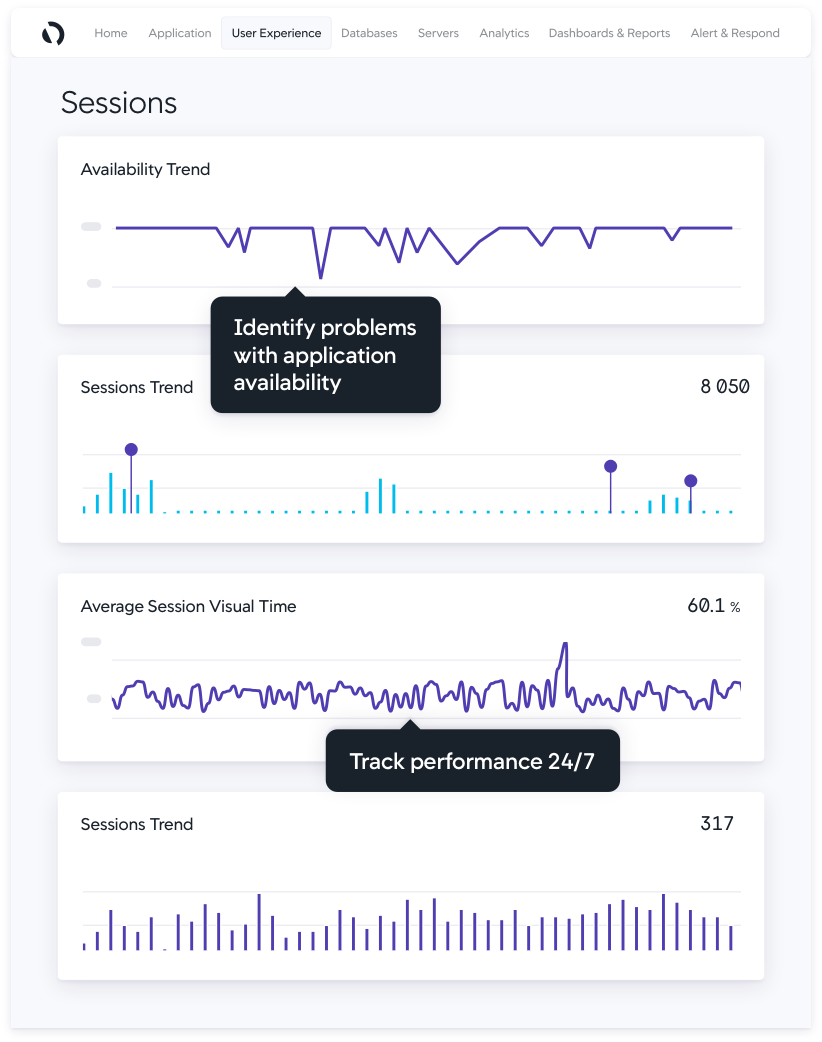
Gain richer insights into data
Understand and easily explore your data with powerful data-binding options and simple sentence-like queries.
Typeahead capabilities allow you to quickly explore your data to build the optimal dashboards
Ensure all users can find and make sense of the data that matters most to them with simplified querying
Share dashboards to unify teams on a common view

Design mission-ready dashboards in minutes
The Dashboard Editor mimics familiar design tools to easily build and edit dashboards.
Build a seamless layout using customizable data widgets and intuitive alignment guides
Change visual settings, add labels and compare application performance across different time ranges
Preview the dashboard before publishing by using the one-click view mode to hide the editor UX

Build once and scale quickly with reusable components
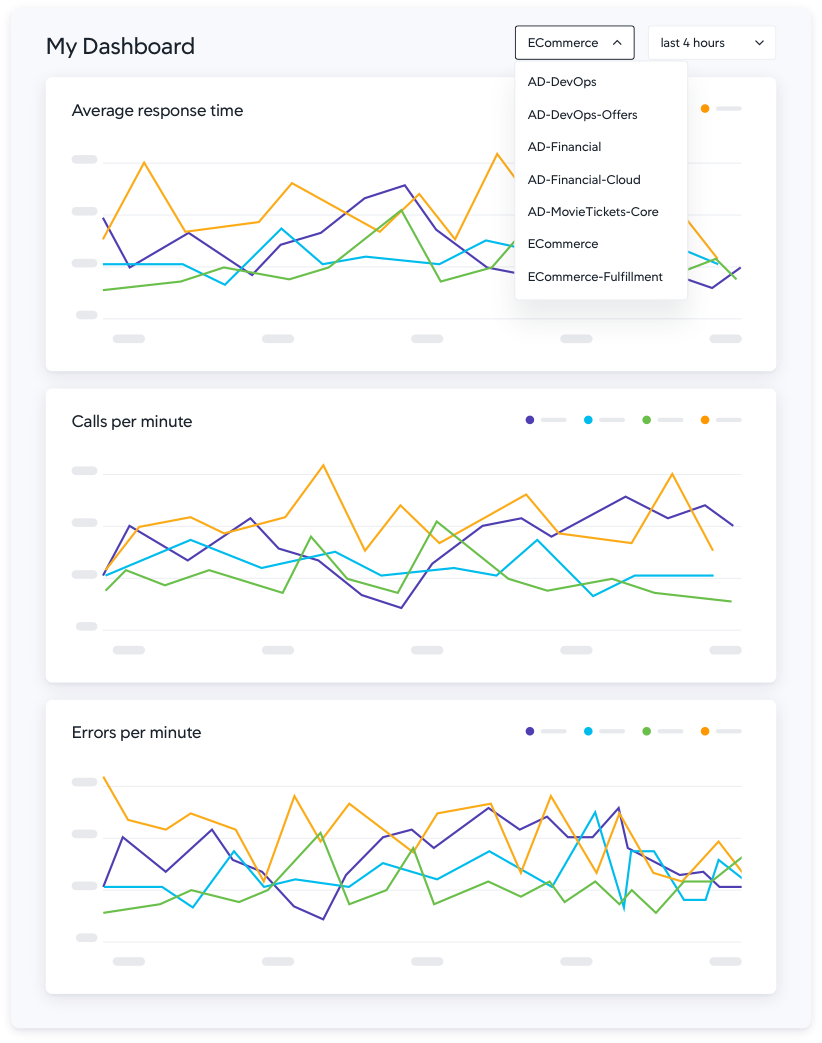
With dashboard variables, easily change your display data without creating a whole new widget.
Bind widgets to common data variables and alter them in view mode to re-render the dashboard for new applications, business transactions, or other supported data
Copy and paste widgets to reuse time-based data and style properties
Quickly develop new dashboards as your business needs evolve
Learn how AppDynamics helps you be proactive and align your organization around the insights most impacting your business.

"We can see everything inside both our dynamic container infrastructure and the microservices running inside the containers. AppDynamics gives us unprecedented insight. "
Philippe Dono
Head of the Core Platform and Performance Team, Privalia
Learn more about custom data visualization with AppDynamics
View all resources
AppDynamics and ThousandEyes extend complete visibility and collaboration across your entire application ecosystem
Say goodbye to silos and gain end-to-end application delivery chain visibility.

Dashboards and Reports: Dash Studio
AppDynamics Dash Studio (Preview) is a next generation dashboard designed to make building dashboards faster and easier. It is available in the Dash Studio (Preview) tab under Dashboards & Reports.

Dashboard Dos and Don’ts
A custom dashboard lets the user display a specific set of metrics and data points on a single screen. Custom dashboards can show application, server, and database metrics reported by AppDynamics Agents.

Achieving end-to-end visibility with Cisco AppDynamics and ThousandEyes
How to bring application observability and network intelligence together with ease.
Thank you! Your submission has been received!
Oops! Something went wrong while submitting the form